CogDAM BI, Business Analytics suite for Digital Media Asset Management
CogDAM BI is a Business Analytics suite which provides viewer statistics and performance of video content with its flagship digital asset management solution CogDAM.
Media and Entertainment industry has emerged as one of the most innovative industries and hasconstantly looked towards adapting new technologies to showcase their content. With ever increasing the number of visitors, this industry is counted among the most sought after targets for marketing and generating user awareness of other products. If an advertising company wants to reach to maximum viewers, it will try to determine the time when most users are logged in, their location, what do they prefer to view, how much time do they spend using the system. The answers will help the advertising company to carry out targeted marketing campaign.
The onus to supply these statistics rests with the media management organization. After all, this data is a revenue generator. CogDAM BI provides this statistics. The analytic engine is designed to generate statistics based on the role of the user logged in and presents data on various dashboards through use of HTML5 / JS as colorful self-explanatory charts.
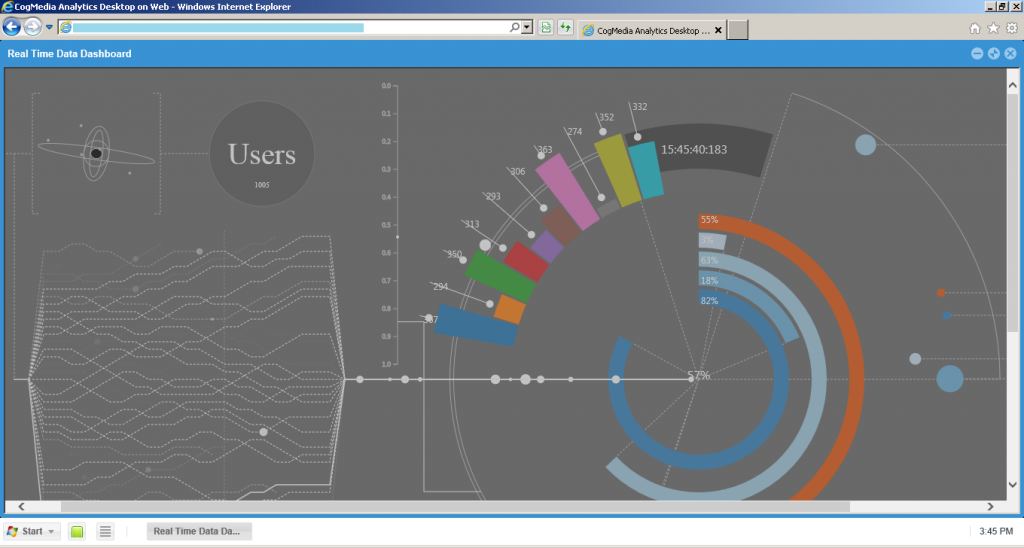
Besides the all familiar matrices which display the number of views , minutes consumed , region the user belongs to, next media viewed by a user after a particular view and videos viewed per person, CogDAM BI presents data about peculiar user behavior through a series of dashboards which display data with respect to time.
• Number of times a media asset was played / Capturing each Play/stop Event
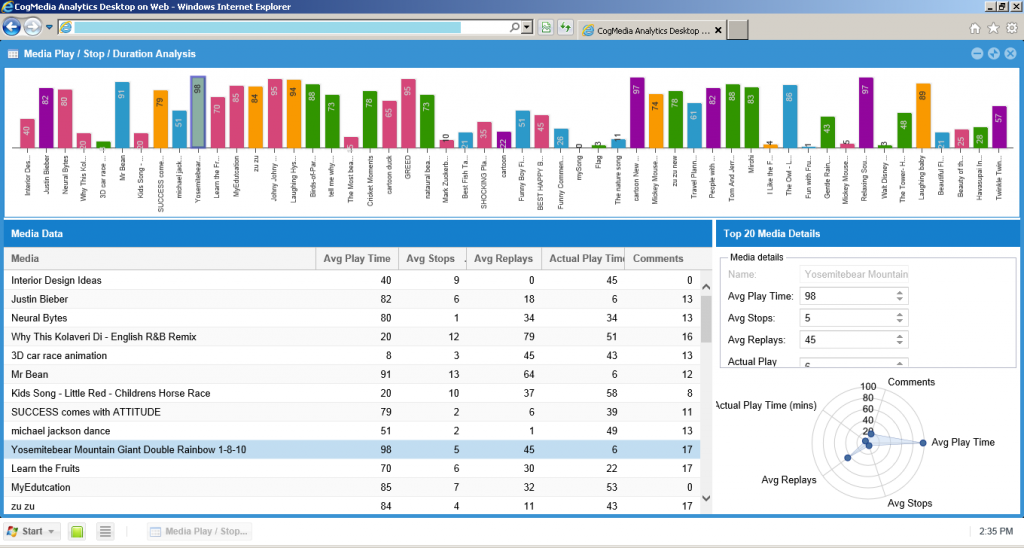
• Duration of Play / Per User / Aggregate Information
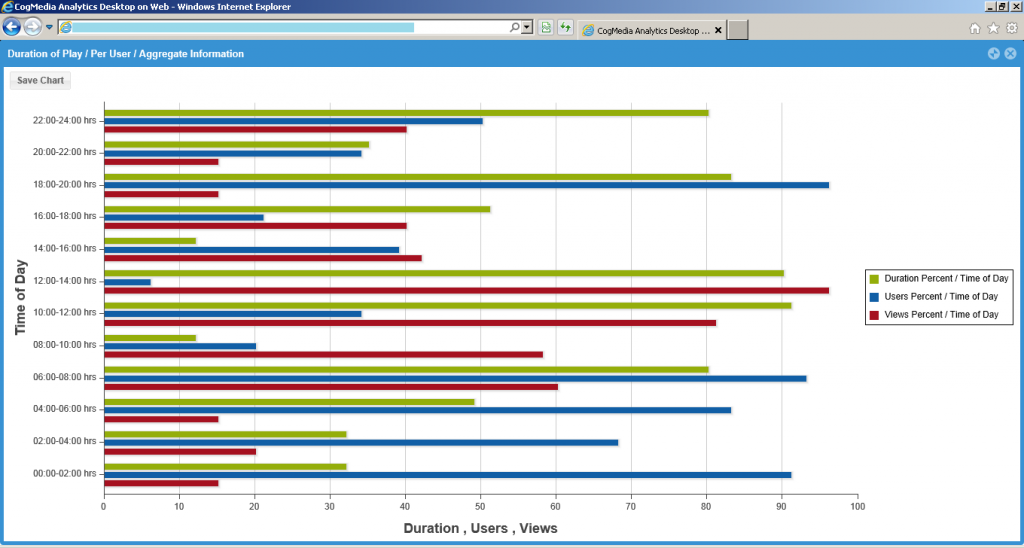
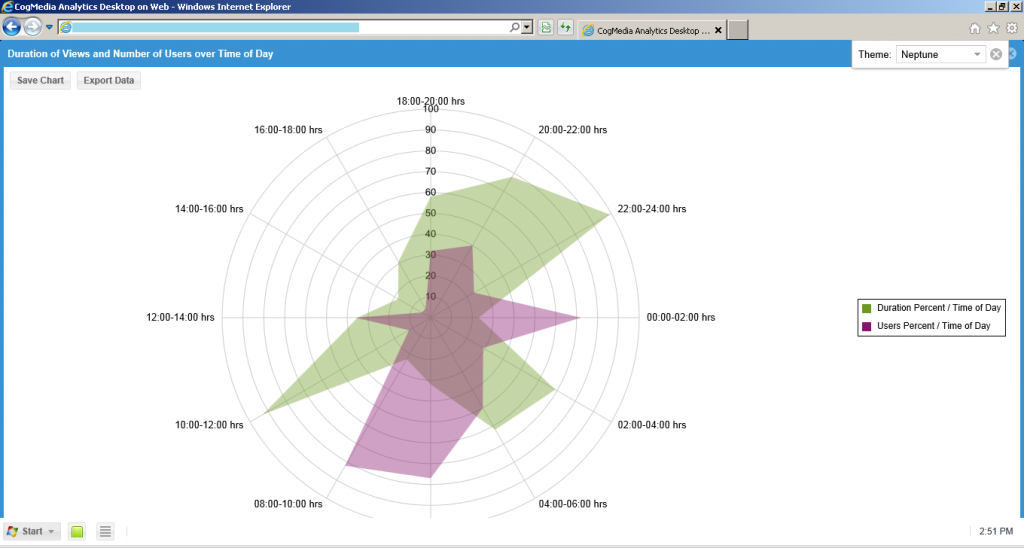
• Frequency of play with respect to Time of Day / User
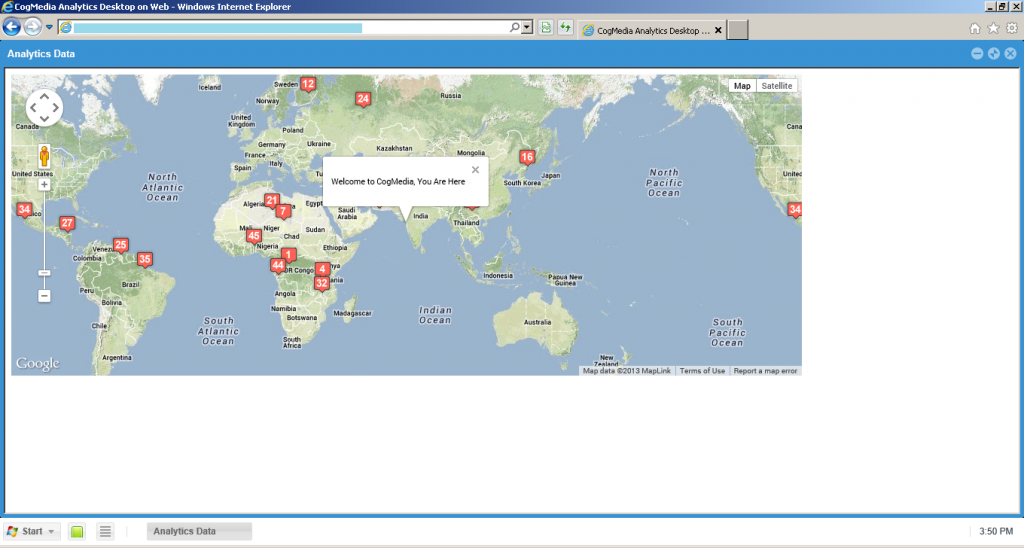
• Geographic Distribution overlays on map
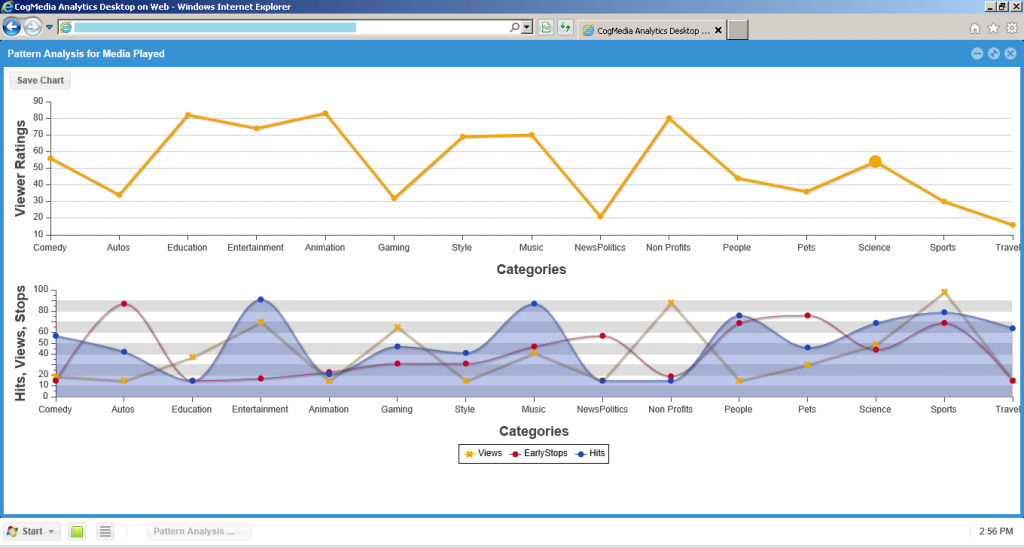
• Pattern of Related Media Assets being played
• Meta tags With respect to User and time
• Pattern Usage WITH RESPECT TO Publisher and Category
• Feedback Pattern Per Media asset and Category
• Most Ordered / Most Searched Track / Most Searched Keywords
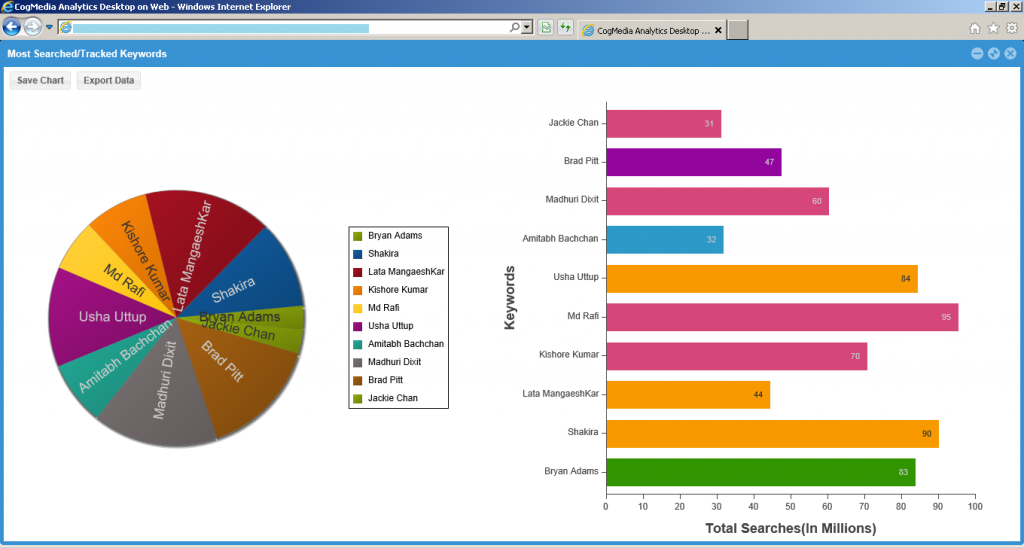
• Time /Category/Metadata Pattern of consumer
The Publisher Analytics Dashboard: presents data about vendor’s actions and type of content he uploads.
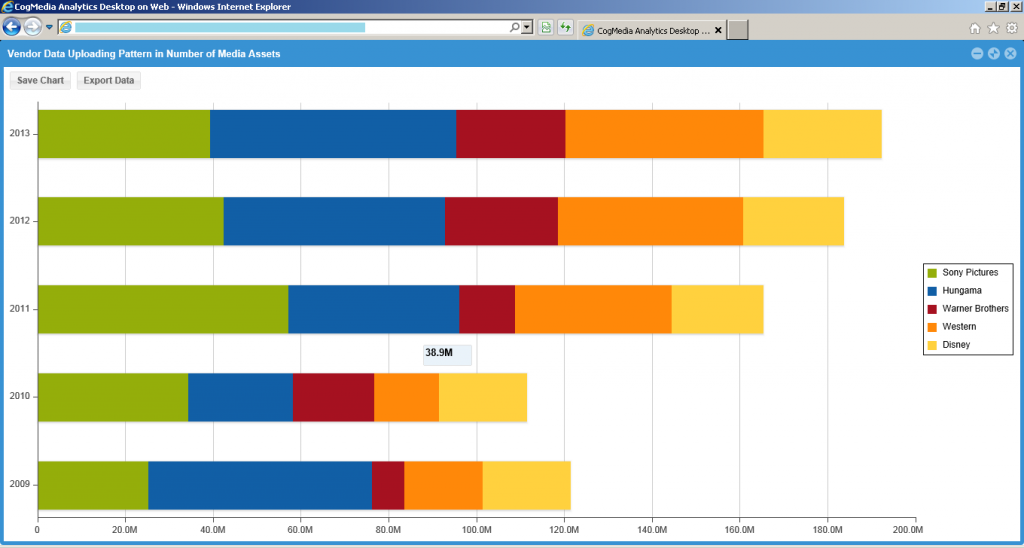
• Vendor Data Uploading Pattern
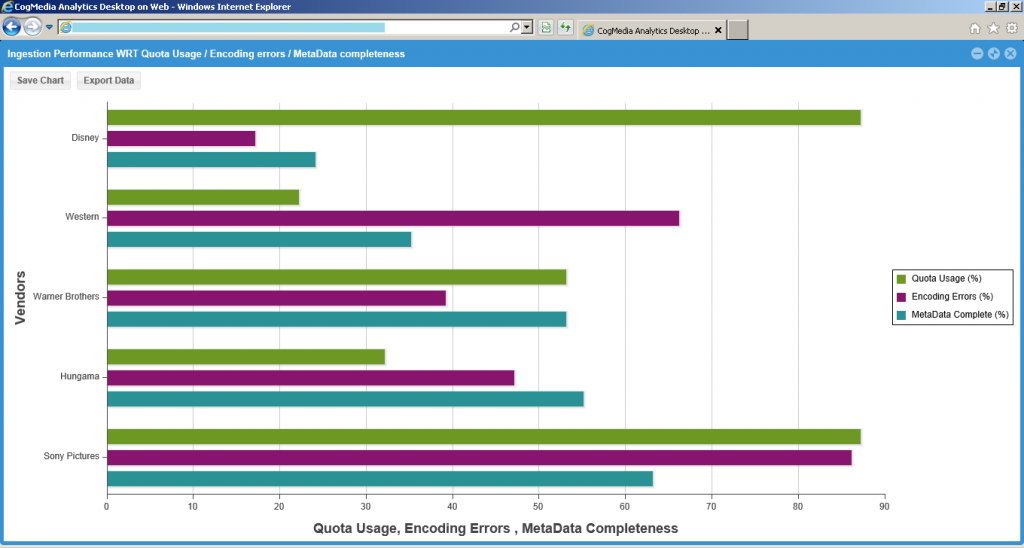
• Ingestion Performance WITH RESPECT TO Error of assets loaded / Encoding errors / Metadata completeness
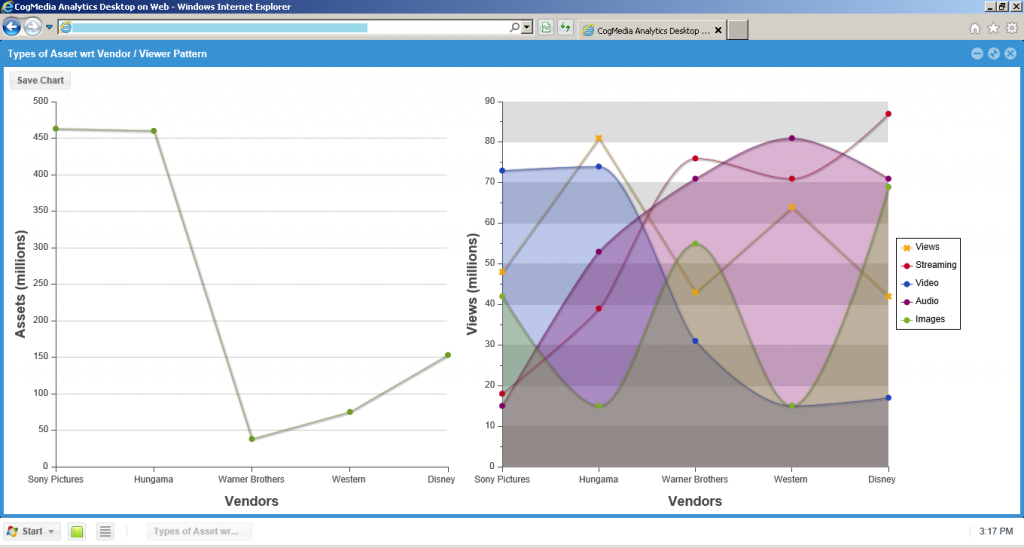
• Types of Asset With respect to Vendor Over time / Publish pattern Per User
• Content Performance Metrics: Asset Ready for Distribution
• If Integrated with Ad Server, Analytics for Advertisement connected to DoubleClick
IT Administrators Dashboards focuses on data related to:
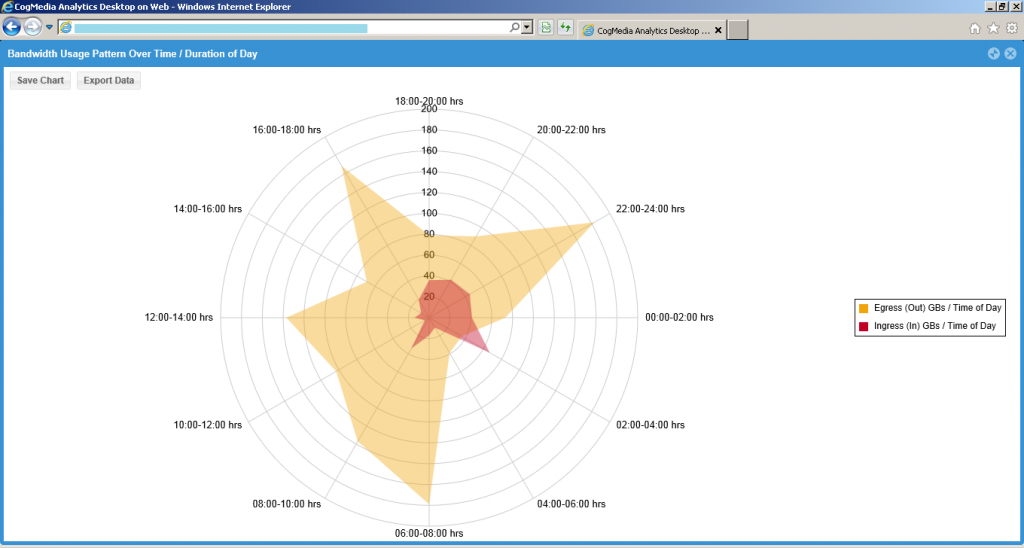
• Bandwidth usage Pattern Over Time / Duration of Day
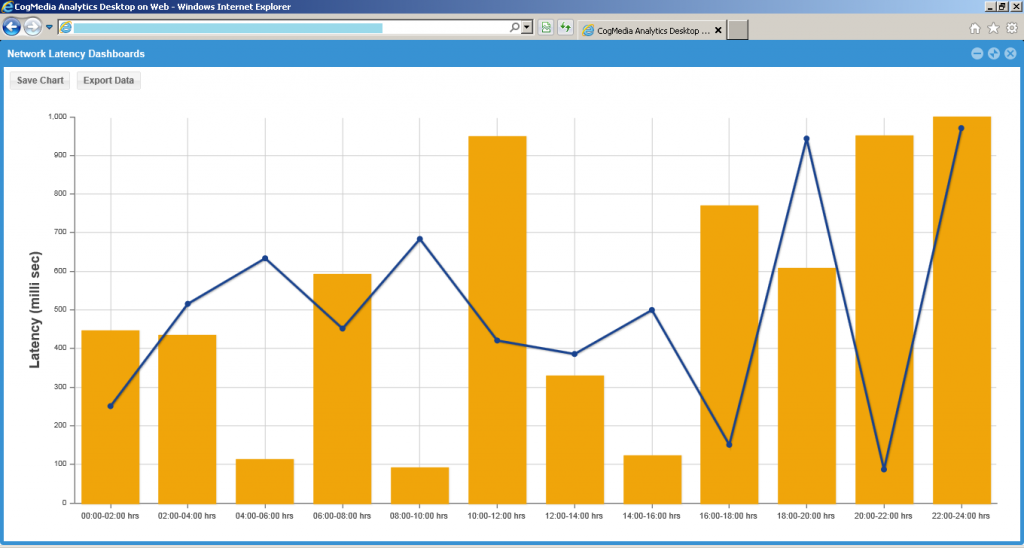
• Network latency Dashboards for Asset / Time to Serve Content
• Storage Dashboard – Percent Growth / utilization /
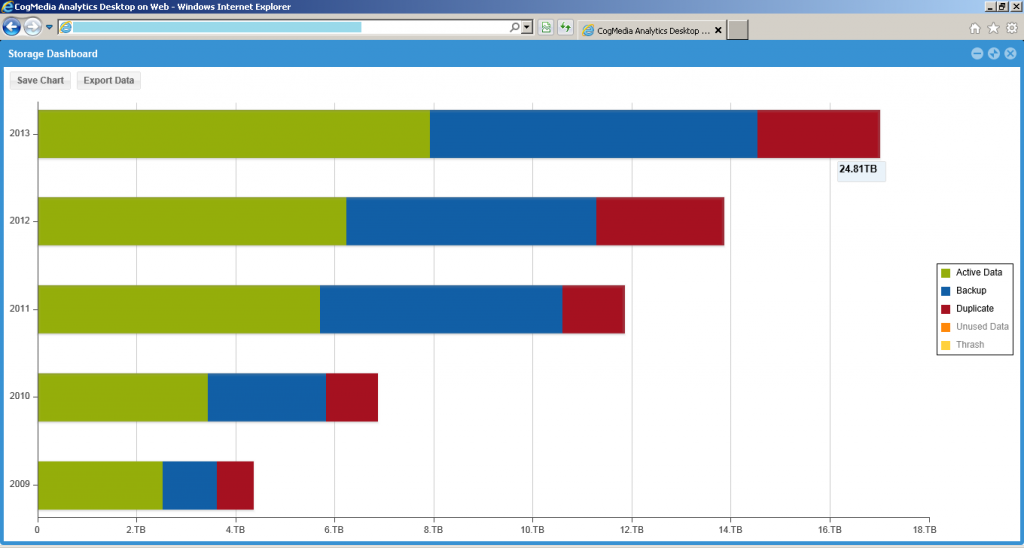
• CogCache Utilization Dashboard: Cache Misses / Errors / Hit Performance ratio
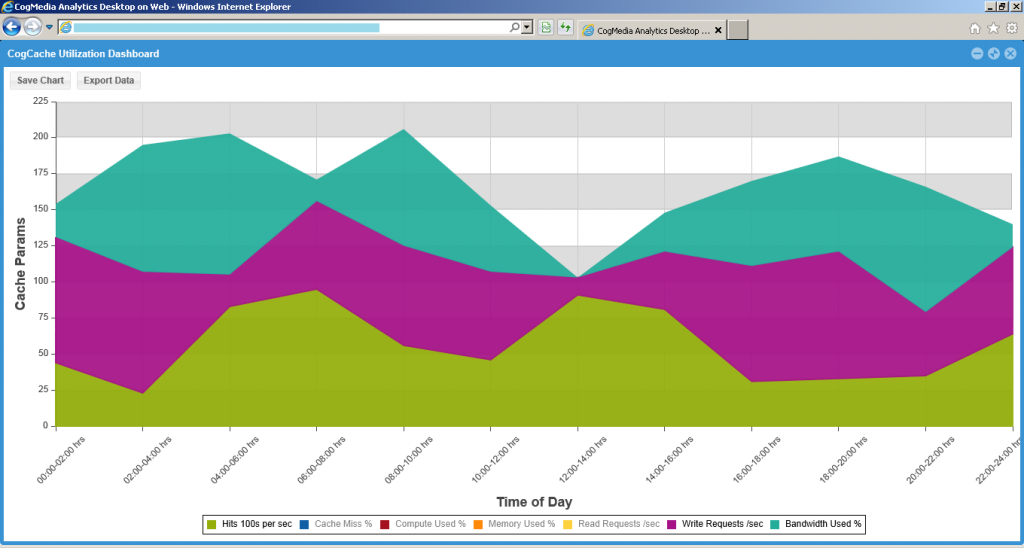
• App Server / Streaming Server / Cache Server : Resource Utilization
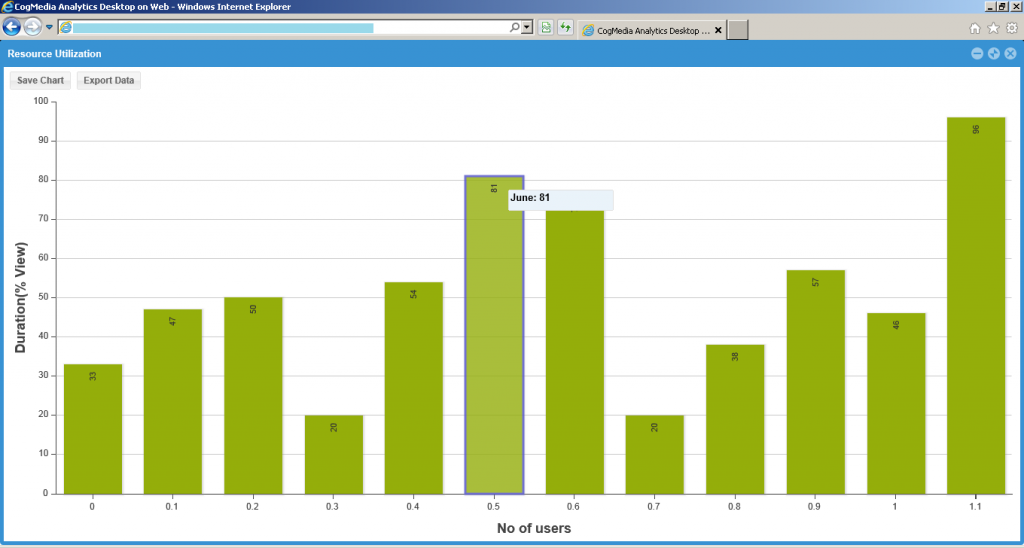
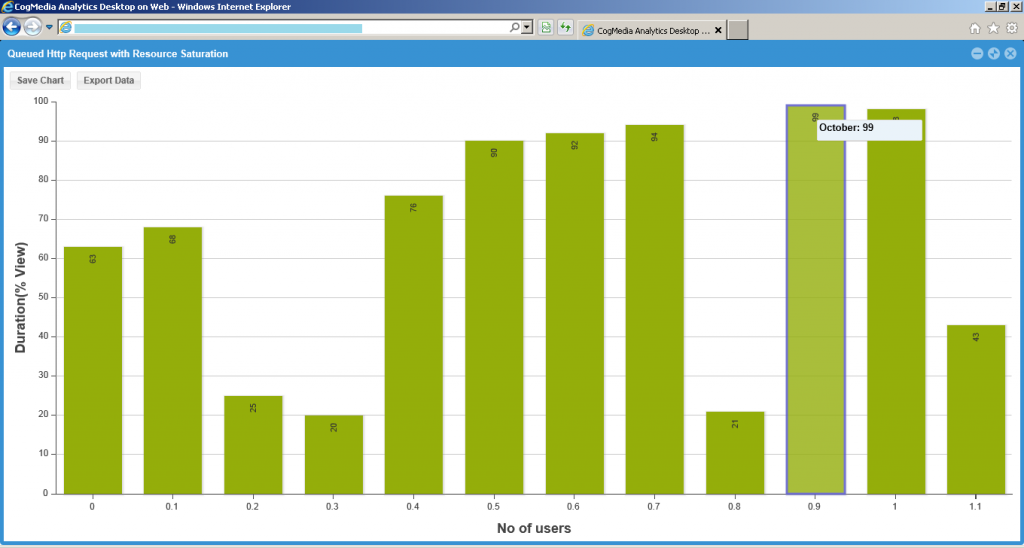
• Queued Http Request With respect to Resource Saturation
Please email sales@cogno-sys.com for more details.
